Category:Graphs
Jump to navigation
Jump to search
Note: Images should not be categorized here.
This is a disambiguation page – a navigational aid which lists other pages that might otherwise share the same title. If an internal link referred you here, you might want to go back and fix it to point directly to the intended page.
See also: Special:Categories/Graphs, Special:PrefixIndex/Category:Graphs and all pages with titles containing “Category:Graphs”
|
Graphs may refer to:
- Category:Graphs (graph theory) as studied in Category:Graph theory
- Graphs of functions, see for example Category:Function plots and Category:SVG x-y functions.
- Category:Charts
- Category:Diagrams
Wikimedia disambiguation page | |||||
| Instance of | |||||
|---|---|---|---|---|---|
| |||||
Subcategories
This category has only the following subcategory.
G
Media in category "Graphs"
The following 200 files are in this category, out of 241 total.
(previous page) (next page)-
1995-2022 Ave Maadi Differences.png 619 × 730; 26 KB
-
2020 04 21 - Gabinete crisis y posterior rueda de prensa (49801918707).jpg 3,008 × 2,000; 3.28 MB
-
3 node Directed graph.png 600 × 529; 36 KB
-
3D graphing problem.png 733 × 733; 78 KB
-
3dlassoridge.png 1,400 × 700; 217 KB
-
500k (5141388411).jpg 823 × 445; 123 KB
-
Aberavon Election Results 1918-2019.png 3,017 × 1,516; 171 KB
-
Aberdeen North Results 1900-2019.png 3,349 × 1,531; 243 KB
-
Age of VPs Graph.png 449 × 310; 5 KB
-
Airdrie & Shotts Results 1997-2021.png 2,546 × 1,498; 124 KB
-
Aki-Imuro sta graph.jpg 402 × 279; 23 KB
-
Altman Z Score AutoMakersAug2022.svg 524 × 744; 126 KB
-
Alyn & Deeside Results 1983-2019.png 2,590 × 1,576; 126 KB
-
Angus Results 1997-2019.png 2,546 × 1,498; 119 KB
-
Análisis gráfico de un límite.jpg 1,859 × 1,075; 253 KB
-
AR DEM SCORE.png 2,178 × 1,452; 186 KB
-
Ashford Results 1900-2019.png 3,460 × 1,625; 192 KB
-
Ashton-Under-Lyne Results 1900-2019.png 3,460 × 1,739; 243 KB
-
Australian lithium exports.svg 531 × 351; 42 KB
-
Auswertung Studienteilnehmer SMART-Analyse BMII.png 1,183 × 769; 616 KB
-
Average working hours per worker.png 1,299 × 917; 159 KB
-
Avnance del minêyolodjince.jpg 418 × 361; 35 KB
-
AYool CFC-113 history.png 1,700 × 1,429; 84 KB
-
Bar graph break.svg 95 × 122; 1 KB
-
Bluesky Registered Users.svg 960 × 576; 37 KB
-
CAISO 05-23-2023 2.png 1,101 × 534; 103 KB
-
Camino Euleriano.png 508 × 508; 14 KB
-
Capital cities with 25 sister cities or more - graph.png 740 × 500; 19 KB
-
Cas4wiki plot3d 01.png 1,472 × 881; 257 KB
-
CBOAmericanHealthCareAct Pg 37 graph.jpg 759 × 383; 79 KB
-
Children smoking and drinking in Wales.png 668 × 539; 110 KB
-
H.E.S.O PF&D.png 362 × 357; 48 KB
-
HESO PFD.jpg 1,096 × 1,103; 207 KB
-
Conceptual Knowledge Graph used in the Earth Metabolome Initiative.svg 1,994 × 1,153; 73 KB
-
Cost Profit Volume Graph.png 445 × 445; 63 KB
-
COVID-19 related Wikimedia pageviews, 2019-2022, pageviews by access method.png 1,997 × 1,000; 180 KB
-
COVID-19 related Wikimedia pageviews, 2019-2022, pageviews by continent.png 1,997 × 1,000; 221 KB
-
COVID-19 related Wikimedia pageviews, 2019-2022, pageviews.png 1,997 × 1,000; 164 KB
-
CREATE Program Status Chart.png 1,368 × 908; 53 KB
-
CungCau.png 1,011 × 492; 200 KB
-
Curva de Gompertz para EEUU en 2003.svg 400 × 400; 9 KB
-
Cyber-Risk Measurement.jpg 1,915 × 1,048; 510 KB
-
Cyber-Risk Quantification Management.png 1,183 × 980; 133 KB
-
Darwinian appraisals.gif 427 × 206; 11 KB
-
Demography of Igriés from 1900 to 2020.png 650 × 350; 11 KB
-
Diagram of the causes of mortality in the army Wellcome L0050236.jpg 6,066 × 4,378; 4.47 MB
-
Difúze v alveolu.png 1,901 × 807; 24 KB
-
Dissociation number.pdf 458 × 447; 35 KB
-
Downtown Gaming vs Non Gaming.png 912 × 662; 30 KB
-
Dsc 0539 Jpg (115242903).jpeg 2,048 × 1,181; 536 KB
-
DSD(t-A(d)) Ingestion I-131 2014-12-10.png 960 × 720; 42 KB
-
DSD(t-A-m3) I131 Inhalation 2014-12-10.png 960 × 720; 54 KB
-
Early-Stopping Graph.png 1,442 × 1,168; 87 KB
-
Editor Cohort Longevity en.WP.png 1,913 × 1,049; 124 KB
-
Energiemengen 2.png 459 × 318; 8 KB
-
Enhanced-skyrmion-stability-due-to-exchange-frustration-41598 2017 12525 MOESM3 ESM.ogv 19 s, 4,000 × 2,000; 16.3 MB
-
EquaGRAPH Graph pad by points page.jpg 561 × 608; 124 KB
-
Express service graph.png 860 × 581; 46 KB
-
FactorsDecreasingDemand.png 445 × 445; 61 KB
-
FactorsIncreasingDemand.png 445 × 445; 59 KB
-
Fallecidos siniestros viales Chile 1972-2019.jpg 1,134 × 509; 125 KB
-
Fermion doubling dispersion relation.svg 576 × 432; 16 KB
-
Fisher's Polygenic Model.png 1,000 × 600; 39 KB
-
Five pillars of Wikipedia alternate version.svg 512 × 768; 1.54 MB
-
ForgettingCurve.Georgian.svg 277 × 237; 8 KB
-
Free-fall-sim.svg 567 × 319; 16 KB
-
Full Fst Average.png 11,700 × 11,700; 5.19 MB
-
Functions (graph).jpg 310 × 505; 11 KB
-
Fuzzy alt zugehoerigkeit.png 605 × 340; 12 KB
-
Gaskosten.png 482 × 287; 7 KB
-
GIF012-Recta-en-R3-director-paso.gif 698 × 508; 3.79 MB
-
Grafo per cammino minimo.png 537 × 384; 19 KB
-
Grammar of graphics model.svg 435 × 623; 61 KB
-
Graph depicting grave goods at Campo Consolino.png 620 × 604; 124 KB
-
Graph of Merry Hill Local Election Results.png 1,920 × 940; 125 KB
-
Graph of the number of earthquakes.svg 512 × 512; 125 KB
-
Graph23232332.png 560 × 420; 14 KB
-
Graphe projeté sur les noeuds correspondants aux personnes.jpg 3,024 × 1,733; 2.89 MB
-
Graphical representation of cubic polynomials.jpg 1,920 × 1,200; 302 KB
-
GraphRootsFootball Logo.jpg 1,346 × 1,600; 66 KB
-
Graphs-vocabulary.svg 512 × 446; 2 KB
-
Gráfica encuestas primarias PNP.png 2,612 × 1,310; 214 KB
-
Gráfica primarias PPD.png 2,607 × 1,306; 220 KB
-
H2h record w.png 640 × 480; 30 KB
-
H2h record.png 640 × 480; 30 KB
-
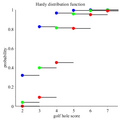
Hardy cdf.svg 500 × 500; 46 KB
-
Hardy Lines cdf.png 400 × 400; 11 KB
-
Hardy Lines pmf.png 400 × 400; 16 KB
-
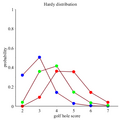
Hardy pmf.svg 500 × 500; 52 KB
-
Hardy probability distribution.png 400 × 400; 17 KB
-
HD@DH.nrw fiktives Diagramm.svg 512 × 389; 8 KB
-
Holocaust Denial Laws 2022.svg 2,754 × 1,398; 1.05 MB
-
Holocaust Denial Laws 2023.png 2,560 × 1,300; 400 KB
-
Hyperbola graph.png 800 × 800; 105 KB
-
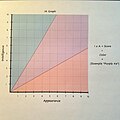
IA graph.jpg 3,024 × 3,024; 4.08 MB
-
Indice pilaf.png 1,592 × 1,150; 103 KB
-
Influence of factors on purchasing decisions by generation.svg 600 × 371; 129 KB
-
Ionizacijska energija.png 800 × 333; 59 KB
-
Irwin modification.jpg 1,450 × 894; 75 KB
-
Isotherme Typ1.jpg 2,226 × 1,824; 2.05 MB
-
Izlazci FINAL.jpg 567 × 330; 52 KB
-
Japanese-School-in-London students-and-teachers-number-data 2023-05.svg 9,877 × 5,692; 128 KB
-
Japanese-School-in-London students-teachers-number-data 2023-05.png 2,874 × 1,656; 247 KB
-
Join-3-4-gons.png 843 × 778; 39 KB
-
Kapacitetsfaktor svensk sol- och vindkraft säsongsvariation 2011-2021.png 1,920 × 1,440; 138 KB
-
Kapacitetsfaktor svensk sol- och vindkraft årsmedelvärden 2011-2021.png 1,920 × 1,440; 169 KB
-
Kapacitetsfaktor svensk vindkraft 2011-2021.png 1,920 × 1,440; 227 KB
-
Kenya Human Development Index computed by the UN.png 606 × 340; 10 KB
-
KM zuhaitza22.png 1,223 × 939; 190 KB
-
Knowledge graph entity alignment.png 1,221 × 650; 110 KB
-
Koldo Mitxelena Zuhaitz Akademikoa (tesiak).png 1,038 × 768; 129 KB
-
Količina padalina za Sisak i Zadar u zimi.jpg 1,027 × 971; 89 KB
-
LAMF - 2023.png 1,500 × 500; 180 KB
-
LDpred2 example.png 1,116 × 739; 90 KB
-
Level of floods, drought and tropical cyclones in Greece, 2000-2020.png 1,078 × 934; 62 KB
-
Local service graph.png 865 × 578; 82 KB
-
LociEffects.png 1,267 × 739; 98 KB
-
Magnus Carlsen Elo february 2023.svg 783 × 583; 258 KB
-
Markov Chain for String Generation Example.png 808 × 535; 26 KB
-
Mars Rover Comparison Distance Graph.svg 576 × 432; 242 KB
-
Martensite to Austenite transition graph.svg 886 × 567; 46 KB
-
ME-CFS Incidence Rate by Age.png 494 × 336; 11 KB
-
ME-CFS onset numbers by age.png 472 × 321; 18 KB
-
Microsoft Edge 1 27 2020 1 18 47 AM (2).png 487 × 377; 80 KB
-
Mixed service graph.png 892 × 561; 55 KB
-
MURDERS IN NEW YORK CITY BY YEAR.png 600 × 371; 26 KB
-
Naseleniediagramahrabursko.png 440 × 300; 3 KB
-
Natural gas consumption in China.jpg 361 × 216; 14 KB
-
Nelson-diagramm.svg 293 × 284; 79 KB
-
Netflix Original Movies.svg 512 × 362; 166 KB
-
NetworkGraph.png 2,012 × 1,132; 307 KB
-
Nuevos casos por dia COVID-19 Venezuela.png 486 × 295; 20 KB
-
NumPlayer vs. Year.png 1,328 × 1,110; 54 KB
-
Old Order Amish in the 20th century.png 825 × 619; 73 KB
-
One way shape memory effect.svg 797 × 407; 45 KB
-
Optimalalpha.png 1,686 × 1,103; 121 KB
-
Orgasm.png 800 × 600; 40 KB
-
OrgasmTime.jpg 842 × 595; 41 KB
-
ParetoFront nicht konvex.png 1,926 × 1,644; 70 KB
-
Partial autocorrelation function.png 480 × 480; 4 KB
-
Pop distribution.png 2,048 × 2,048; 286 KB
-
Population of Gulshan-e-Iqbal.png 1,799 × 1,075; 202 KB
-
Problem Solving Process.png 445 × 445; 59 KB
-
Product X Example S-Curve Waters.jpg 534 × 292; 25 KB
-
PropagationGraphPartialResponseAnimation.png 1,211 × 937; 2.95 MB
-
Proportionalität graphisch dargestellt 1 2017 PD.svg 2,126 × 1,594; 30 KB
-
Proportionalität graphisch dargestellt 10 2017 PD.svg 2,126 × 1,594; 24 KB
-
Proportionalität graphisch dargestellt 11 2017 PD.svg 2,657 × 2,303; 41 KB
-
Proportionalität graphisch dargestellt 12 2017 PD.svg 3,189 × 3,189; 99 KB
-
Proportionalität graphisch dargestellt 12a 2017 PD.svg 3,189 × 3,189; 99 KB
-
Proportionalität graphisch dargestellt 2 2017 PD.svg 2,126 × 1,594; 23 KB
-
Proportionalität graphisch dargestellt 20 2017 PD.svg 2,657 × 1,594; 33 KB
-
Proportionalität graphisch dargestellt 21 2017 PD.svg 2,657 × 1,594; 33 KB
-
Proportionalität graphisch dargestellt 22 2017 PD.svg 2,657 × 2,657; 34 KB
-
Proportionalität graphisch dargestellt 23 2017 PD.svg 2,657 × 1,594; 32 KB
-
Proportionalität graphisch dargestellt 24 2017 PD.svg 2,657 × 2,657; 35 KB
-
Proportionalität graphisch dargestellt 25 2017 PD.svg 2,657 × 2,657; 30 KB
-
Proportionalität graphisch dargestellt 3 2017 PD.svg 2,126 × 1,594; 24 KB
-
Proportionalität graphisch dargestellt 4 2017 PD.svg 2,303 × 1,772; 30 KB
-
Proportionalität graphisch dargestellt 5 2017 PD.svg 2,126 × 1,594; 30 KB
-
Proportionalität graphisch dargestellt 7 2017 PD.svg 2,126 × 1,594; 24 KB
-
Proportionalität graphisch dargestellt 8 2017 PD.svg 2,657 × 1,594; 32 KB
-
Proportionalität graphisch dargestellt 9 2017 PD.svg 2,657 × 2,303; 33 KB
-
Proportionalität graphisch dargestellt 9a 2017 PD.svg 2,657 × 2,303; 28 KB
-
Protel milestones.png 2,480 × 1,504; 924 KB
-
Quadrato di opposti.gif 255 × 305; 18 KB
-
Railway passenger volume.png 711 × 408; 27 KB
-
Rank-Size Rule in Japan 1920-1980.svg 1,638 × 1,440; 68 KB
-
Rates of STD by Race in the United States from 2015 to 2020, TSH.png 1,098 × 677; 85 KB
-
Recall graph for many Ks.png 1,194 × 772; 145 KB
-
Resorpce glukózy v ledvinách.png 940 × 613; 31 KB
-
Revenue of Nikopol.png 750 × 464; 24 KB
-
Same sex contacts among teens.png 1,045 × 846; 200 KB
-
Schedule of births and deaths for 1865–1915 in the village of Kichkalnya.png 1,593 × 643; 171 KB
-
Siblingcorrelation.png 1,440 × 864; 141 KB
-
Sine Approximation Difference Graph.png 564 × 330; 25 KB
-
Složení borosilikátového skla.png 2,526 × 1,462; 98 KB
.svg/120px-1974_United_States_Senate_vice_presidential_confirmation_vote_(party_breakdown).svg.png)


.jpg/120px-2020_04_21_-_Gabinete_crisis_y_posterior_rueda_de_prensa_(49801918707).jpg)


.jpg/120px-500k_(5141388411).jpg)


_-_ECU-EUR_vs_USD_currency_change_(1972-2022).png/120px-Cambio_ECU-EUR_vs_USD_(1972-2022)_-_ECU-EUR_vs_USD_currency_change_(1972-2022).png)




_scale.jpg/120px-Cumulative_density_plot_of_all_systems_over_the_e-mental_Health_Degree_of_Technological_Sophistication_(eHDTS)_scale.jpg)



.jpeg/120px-Dsc_0539_Jpg_(115242903).jpeg)
)_Ingestion_I-131_2014-12-10.png/120px-DSD(t-A(d))_Ingestion_I-131_2014-12-10.png)
_I131_Inhalation_2014-12-10.png/120px-DSD(t-A-m3)_I131_Inhalation_2014-12-10.png)


_°_CO2_emissions_per_capita_-_Russia-USSR_(1912-1932).png/120px-Emissioni_CO2_pro-capite_-_Russia-URSS_(1912-1932)_°_CO2_emissions_per_capita_-_Russia-USSR_(1912-1932).png)
_-_CO2_emissions_per_capita_in_UK_(1800-1873).png/120px-Emissioni_CO2_pro-capite_nel_Regno_Unito_(1800-1873)_-_CO2_emissions_per_capita_in_UK_(1800-1873).png)






.jpg/73px-Functions_(graph).jpg)


_-_Italian_general_elections_graph_(1946-2022).svg/120px-Grafico_delle_elezioni_politiche_in_Italia_(1946-2022)_-_Italian_general_elections_graph_(1946-2022).svg.png)


.png/120px-Graph_Rates_of_STD_by_Race_in_the_United_States_from_2015_to_2020%2C_TSH_(cropped).png)
.png/120px-Graph%2C_Percent_of_STD_cases%2C_per_100%2C000%2C_by_week_in_2020_in_the_United_States%2C_Timothy_Holdiness_(cropped).png)






.png/120px-Key_for_Percent_of_STD_cases%2C_per_100%2C000%2C_by_week_in_2020_in_the_United_States%2C_Timothy_Holdiness_(cropped).png)
.png/120px-Key_for_Rates_of_STD_by_Race_in_the_United_States_from_2015_to_2020%2C_TSH_(cropped).png)


.png/120px-Koldo_Mitxelena_Zuhaitz_Akademikoa_(tesiak).png)




.png/120px-Microsoft_Edge_1_27_2020_1_18_47_AM_(2).png)


