Category:Pie charts
Jump to navigation
Jump to search
circular statistical graphic | |||||
| Upload media | |||||
| Subclass of | |||||
|---|---|---|---|---|---|
| Different from | |||||
| |||||
English: A pie chart (or a circle graph) is a circular chart divided into sectors, illustrating relative magnitudes or frequencies.
Pie charts are categorized:
- by created with: Hand drawn, software (like R, Mathematica, Gnuplot, ...)
- by file format: SVG, PNG, JPG, PDF, TIFF, ... (see also: Category:Images by file format)
- by language: Language-neutral, English, French, ...
- by theme:
- by type: 3D, Concentric, Doughnut, Exploded, Fraction, Polar area
Subcategories
This category has the following 16 subcategories, out of 16 total.
3
B
- Bar of pie charts (4 F)
C
- Concentric pie charts (5 F)
D
E
F
- Fractions (pie chart) (53 F)
H
L
- Language-neutral pie charts (194 F)
M
- Multi-series pie charts (47 F)
P
- Pie of pie charts (15 F)
S
- Spie charts (1 F)
- SVG pie charts (510 F)
V
- Variable-radius pie charts (2 F)
Media in category "Pie charts"
The following 200 files are in this category, out of 234 total.
(previous page) (next page)-
1993sistemasoperativos.png 574 × 364; 36 KB
-
2011 HU Shares.png 988 × 685; 45 KB
-
2019 su uretim kgd.jpg 663 × 507; 79 KB
-
2021 Remaining Carbon Budget.svg 512 × 258; 8 KB
-
3c71d3 ab421b3ee18e4e37b4ef0eb16cef47d1~mv2.png 678 × 469; 87 KB
-
41598 2020 59061 Fig4 HTML.webp 1,495 × 563; 26 KB
-
999-percentages.jpg 715 × 686; 83 KB
-
99point9 White.svg 1,165 × 1,130; 3 KB
-
99point9.svg 1,000 × 1,000; 3 KB
-
Adeyemo, Azalia Assigment 3.jpg 962 × 610; 36 KB
-
Allianz AG.png 1,024 × 1,024; 53 KB
-
Analytics 2016-02-26 at 10.19.24 AM.jpg 5,472 × 3,648; 1.97 MB
-
Animated colorful pie chart small slice.gif 253 × 256; 39 KB
-
Animated pie chart backwards green pink 360 to 0.gif 315 × 315; 149 KB
-
Animated pie chart green pink 0 to 360.gif 525 × 525; 114 KB
-
Animated pie chart green pink with legend.gif 800 × 600; 256 KB
-
Animated pie chart pink green 0 to 360.gif 315 × 315; 90 KB
-
Application graphique.jpg 3,840 × 5,120; 9.88 MB
-
Ativos(mais de 5 edições) na Wikipédia lusófona.png 763 × 320; 12 KB
-
Auswertung der KM in Anzahl der Beiträge.PNG 742 × 671; 41 KB
-
Auswertung der KM in Bytes.PNG 735 × 667; 26 KB
-
Autoconfirmed article status pie chart 14 June 2017.png 719 × 371; 16 KB
-
Bengali Vocabulary.png 364 × 411; 6 KB
-
BIGMUSIC.JPG 267 × 273; 11 KB
-
Blacklisted Images.png 2,716 × 2,716; 337 KB
-
BluFin CCI Headline Numbers.png 610 × 319; 68 KB
-
Bottineau Co ND Pie Chart 3-5-17 No Text.pdf 1,650 × 1,275; 97 KB
-
Bouw1.jpg 481 × 289; 19 KB
-
Brainmaps4.jpg 1,141 × 945; 107 KB
-
BurmishInST.png 834 × 1,024; 75 KB
-
C7ay00656j-f3 hi-res.gif 980 × 1,679; 276 KB
-
Campden 2.png 430 × 400; 29 KB
-
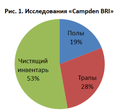
Campden BRI.png 352 × 329; 21 KB
-
Campden.jpg 253 × 260; 7 KB
-
Capacidade Atual da Barragem de Água Fria.png 551 × 292; 21 KB
-
CARTA PAI PELAJAR TAHUN 2017.png 522 × 338; 24 KB
-
Cascadehpphrazdansevanchart.png 514 × 242; 71 KB
-
Categorized references from Article Gay on the English Wikipedia.png 1,252 × 754; 107 KB
-
Cenymaksymalne20220215.png 1,024 × 768; 78 KB
-
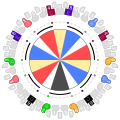
Circle of inverted triads on white keys.svg 3,402 × 3,402; 250 KB
-
Citizens Advice Funding Sources.png 531 × 650; 22 KB
-
Class distribution US.png 466 × 391; 9 KB
-
CO2 emission pie chart as.svg 540 × 540; 8 KB
-
CO2 emission pie chart-ml.svg 540 × 540; 32 KB
-
CO2 emission pie chart-ne.svg 432 × 432; 13 KB
-
CO2 emission pie chart-ta.svg 540 × 540; 33 KB
-
CO2 emission pie chart.te.svg 432 × 432; 12 KB
-
CO2 Emissions from Fossil Fuels - 2018.png 2,000 × 1,195; 914 KB
-
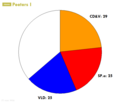
Coalitiezetels-PeetersI08.png 700 × 600; 7 KB
-
Comment fonctionne le Musée fromage FR.jpg 2,018 × 2,037; 282 KB
-
Comparison of mass and energy consumption of the human brain.png 1,280 × 720; 69 KB
-
Content of Tweets Graphed.png 600 × 463; 36 KB
-
Cornell 1.png 899 × 505; 91 KB
-
Cornell 2.png 834 × 399; 40 KB
-
Costa Rica electricity.0.png 647 × 358; 41 KB
-
De-Kreisdiagramm.ogg 2.0 s; 19 KB
-
De-Tortendiagramm.ogg 2.0 s; 19 KB
-
Den klassiska kinesiskans morfologiska typologi.svg 800 × 600; 1 KB
-
Deudadevzla.jpg 739 × 464; 28 KB
-
Différents ERP.png 320 × 333; 96 KB
-
Donceel - utilisation terrain.png 1,586 × 1,591; 1.84 MB
-
EDBL tarta flexionatuak eta ez.independenteak.png 660 × 335; 19 KB
-
EDBL tarta hitz anitzekoak.png 694 × 328; 17 KB
-
EHRadoption.gif 1,332 × 1,128; 16 KB
-
Elaeocarpus dentatus drupe composition dry weight basis.jpg 2,023 × 1,256; 255 KB
-
Emissions-by-sector-–-pie-charts.png 1,302 × 1,233; 265 KB
-
Ethiopian economy division.pdf 1,275 × 1,650; 47 KB
-
Ethnic composition.jpg 361 × 573; 39 KB
-
Example pie chart.png 500 × 400; 28 KB
-
Export countries of Greek marbles.jpg 902 × 726; 143 KB
-
FA stats by type (February 2008) piechart.gif 977 × 600; 20 KB
-
Figure 1 gender (Where experts and amateurs meet).png 1,106 × 507; 28 KB
-
Figure 2 age (Where experts and amateurs meet).png 1,141 × 520; 45 KB
-
Figure 2023-11-12 031825.png 349 × 231; 16 KB
-
Figure 3 education (Where experts and amateurs meet).png 1,066 × 517; 30 KB
-
Figure 4 citizenship (Where experts and amateurs meet).png 1,248 × 539; 36 KB
-
Figure 5 expertise (Where experts and amateurs meet).png 1,341 × 546; 39 KB
-
Figure 6 wikipedia experience (Where experts and amateurs meet).png 1,201 × 506; 33 KB
-
Figure 7 wikipedia time per week (Where experts and amateurs meet).png 1,187 × 507; 39 KB
-
Figure 8 focus on medical topics (Where experts and amateurs meet).png 1,257 × 589; 43 KB
-
Global average human diet and protein composition and usage of crop-based products.webp 2,117 × 1,598; 176 KB
-
Global distribution of aviation fuel use.jpg 2,389 × 1,199; 133 KB
-
GlobalMercuryAssessment2013.svg 512 × 648; 4 KB
-
GNOME Disk Usage Analyzer 3.32 screenshot.png 1,445 × 775; 128 KB
-
Grafico70.jpg 280 × 207; 21 KB
-
Grafikon udjela u proizvodnji primarne energije.png 2,918 × 1,625; 148 KB
-
Graph(2).png 600 × 463; 22 KB
-
Graphic methods for presenting facts, p. 6-7.jpg 1,026 × 780; 243 KB
-
Greek polling graph.png 2,623 × 1,057; 173 KB
-
Greenhouse Based Emission MtCo2 Emmisions 2018.jpg 1,115 × 1,222; 230 KB
-
Gráfico Senado Brasileiro em dezembro de 2012.png 600 × 463; 26 KB
-
Heat Loss for combustion engine.jpg 937 × 529; 31 KB
-
História na Wiki April 2021 Survey Result - 01.png 1,240 × 1,160; 60 KB
-
História na Wiki April 2021 Survey Result - 02.png 1,240 × 1,160; 94 KB
-
História na Wiki April 2021 Survey Result - 03.png 1,240 × 1,210; 99 KB
-
História na Wiki April 2021 Survey Result - 04.png 1,240 × 1,160; 71 KB
-
História na Wiki April 2021 Survey Result - 05.png 622 × 582; 28 KB
-
How much I care animated pie chart 0 to 360.gif 515 × 569; 62 KB
-
Illogical.png 308 × 249; 8 KB
-
India handset data.jpg 359 × 304; 22 KB
-
Ingressos pressupost CCMA 2017.svg 347 × 301; 8 KB
-
Iswiki-contributions.png 1,687 × 1,602; 208 KB
-
Kalitate grafika 2007ko urtarrilaren 31.png 504 × 548; 4 KB
-
Kreikan Energian tuotanto 2020.png 1,200 × 800; 91 KB
-
KreisdiagrammTeile.svg 251 × 219; 14 KB
-
Krími köztársasági népesség városi megoszlása.png 865 × 523; 34 KB
-
Studierende nach Fakultät - Uni Köln.svg 800 × 467; 14 KB
-
Malaria Positive Cases Bastar vs Other Division (2019).jpg 581 × 341; 23 KB
-
Male female pie chart.svg 600 × 400; 5 KB
-
Manganese nodules.png 1,567 × 1,029; 497 KB
-
Marktanteile Oesterreichischer Mobilfunkmarkt 2009.gif 557 × 443; 5 KB
-
Marktanteile Zeitschriften 2013.png 271 × 352; 45 KB
-
Masses of asteroids vs main belt Việt hoá bởi Anhdonald.png 800 × 618; 92 KB
-
Matching results Non-US.jpg 383 × 298; 16 KB
-
Matching results US.jpg 382 × 295; 16 KB
-
MD and DO inTexas.PNG 611 × 319; 14 KB
-
Mestres e Doutores cadastrados na Plataforma Lattes (2023).png 567 × 371; 20 KB
-
Military Expenditures by Country 2019.svg 905 × 661; 29 KB
-
MilitaryExpendituresbyCountry2019.png 1,200 × 876; 111 KB
-
Mitgliederstatistik.jpg 570 × 434; 18 KB
-
Mobile web upload deletion stats.png 600 × 420; 15 KB
-
Mobile web uploads post April 11.png 582 × 385; 14 KB
-
Modal awal.jpg 1,301 × 972; 735 KB
-
Modal perubahan.jpg 1,293 × 968; 730 KB
-
New user article status pie chart 14 June 2017.png 697 × 371; 16 KB
-
NextEra Energy Assets Chart FPL and NEER.png 735 × 384; 12 KB
-
Nigeria Real Gross Domestic Product GDP, Q3, 2019.png 1,653 × 993; 62 KB
-
Objetivo-Fama-5-resultados.jpg 375 × 244; 11 KB
-
Odia input reader survey (Feb 16-Mar 16 2016).svg 512 × 227; 51 KB
-
Ofama4.JPG 311 × 189; 9 KB
-
Open-source-license-chart.svg 180 × 180; 68 KB
-
Orange Pie chart diagram.png 1,522 × 848; 50 KB
-
Pac-Man pie chart cropped.jpg 3,200 × 2,400; 2.07 MB
-
Pac-Man pie chart.jpg 4,032 × 3,024; 4.03 MB
-
Percentual corrupcao.jpg 669 × 388; 32 KB
-
Pie Chart 1.png 465 × 335; 50 KB
-
Pie chart graph.png 626 × 726; 49 KB
-
Pie chart of countries by area.png 8,948 × 3,469; 8.07 MB
-
Pie chart of spins.jpg 1,802 × 1,052; 144 KB
-
Pie chart-1.png 972 × 674; 98 KB
-
PieChart of Suicide Rates by Age in Japan.png 587 × 542; 28 KB
-
Playfair piecharts.jpg 6,306 × 3,456; 5.36 MB
-
Pod4.png 1,024 × 768; 88 KB
-
Podíl státních zaměstanců na pracující populaci.jpg 1,264 × 1,015; 117 KB
-
Podíl výdajů podle funkcí sociální ochrany.jpg 685 × 866; 186 KB
-
Political-party-strength-in-puerto-rico-2012.png 2,445 × 2,445; 402 KB
-
PRESIDENCIASCOMISIONES.png 1,185 × 771; 24 KB
-
Przyznany status 2009.jpg 3,983 × 2,973; 424 KB
-
PTT-Archiv P-15-1-1 1991 No 1 Frauen PTT Aufstieg S 13.jpg 1,265 × 1,736; 475 KB
-
PTT-Archiv P-15-1-1 1991 No 1 Frauen PTT Aufstieg S 14.jpg 1,265 × 1,736; 462 KB
-
Radius C (PSF).png 1,089 × 1,033; 104 KB
-
Radonpiechart.png 1,200 × 800; 66 KB
-
Religion in Nazi-Germany 1939 census.png 1,016 × 1,014; 43 KB
-
Religious Demographics in the United States.png 1,653 × 993; 26 KB
-
Religião anajatuba 2010.png 1,863 × 1,404; 348 KB
-
RfA application progression (pie chart).png 881 × 692; 20 KB
-
Schools in Třebíč at 1906 data, pie charts.svg 1,000 × 750; 733 KB
-
Sektorediagrama 001.png 387 × 387; 9 KB
-
Servicios en españa.png 1,920 × 1,080; 154 KB
-
ShareHolders Photo.png 403 × 340; 23 KB
-
Shares in the television market in Poland in 2012.png 1,196 × 996; 125 KB
-
Shares in the television market in Poland in 2013.png 1,158 × 832; 217 KB
-
SIV Assetklasse.GIF 630 × 418; 8 KB
-
Small pie.svg 429 × 425; 1 KB
-
So long und tschüss.png 391 × 533; 21 KB
-
Source of Illinois energy supply.jpeg 1,200 × 800; 44 KB
-
Spanish names&nouns ending in a Statistics2.png 394 × 258; 34 KB
-
Splunk pie.png 1,242 × 587; 279 KB
-
Srananman.PNG 400 × 227; 5 KB
-
Statistik Diagramm Gebrauchtmöbel.png 1,200 × 1,313; 96 KB
-
Strawpoll-logo-large.png 377 × 377; 54 KB
-
Structures des charges en 1998.JPG 2,038 × 1,688; 1.17 MB
-
Strukturawiekubwt.png 383 × 317; 5 KB
-
Studia Uniwersytet Thammasat.png 439 × 402; 12 KB
-
Syrian Australian National Distribution.jpg 3,592 × 2,094; 2.11 MB
-
Taartdiagram Kabinet-Colijn IV.png 474 × 444; 23 KB
-
Taartdiagram Kabinet-Colijn V.png 465 × 398; 31 KB
-
Taartdiagram Kabinet-De Geer II.png 481 × 442; 35 KB
-
Taşpınar Genel Seçim 2009.png 600 × 463; 21 KB
-
TeeChart.Store, dashboard.jpg 1,120 × 600; 109 KB
-
Television channels in the United Kingdom by viewing share 2008.svg 1,400 × 1,240; 59 KB
-
Television companies in Sweden by viewing share 2008.svg 1,500 × 1,100; 27 KB
-
Television companies in Sweden by viewing share 2011.svg 1,500 × 1,100; 40 KB
-
Television companies in Sweden by viewing share 2014.svg 1,500 × 1,100; 53 KB
-
Top editors (including bots) compared to the rest of the community, 8 January 2014.svg 1,650 × 1,275; 260 KB
-
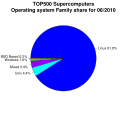
TOP500 operating system family share.svg 630 × 630; 61 KB
-
Tribal composition of people topview500 in kazakh wiki 2019.png 894 × 744; 75 KB
-
Ubuntu Share Of GnuLinux Wikimedia-te.svg 600 × 655; 7 KB
-
Udio energenata u proizvodnji primarne energije za Zapadnu Europu.png 2,392 × 1,578; 135 KB
-
Un nombre original.png 454 × 267; 5 KB
-
US primary energy consumption by source.svg 800 × 600; 15 KB
-
Usage of non-default skins on English Wikipedia 2.png 600 × 371; 22 KB




_na_Wikipédia_lusófona.png/120px-Ativos(mais_de_5_edições)_na_Wikipédia_lusófona.png)







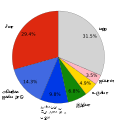
_in_2002.png/120px-Cellulosic_fibre_production_(total_of_2.76_million_tonnes)_in_2002.png)







_piechart.gif/120px-FA_stats_by_type_(February_2008)_piechart.gif)
.png/120px-Figure_1_gender_(Where_experts_and_amateurs_meet).png)
.png/120px-Figure_2_age_(Where_experts_and_amateurs_meet).png)

.png/120px-Figure_3_education_(Where_experts_and_amateurs_meet).png)
.png/120px-Figure_4_citizenship_(Where_experts_and_amateurs_meet).png)
.png/120px-Figure_6_wikipedia_experience_(Where_experts_and_amateurs_meet).png)
.png/120px-Figure_7_wikipedia_time_per_week_(Where_experts_and_amateurs_meet).png)
.png/120px-Figure_8_focus_on_medical_topics_(Where_experts_and_amateurs_meet).png)


.png/120px-Graph(2).png)


.jpg/120px-Malaria_Positive_Cases_Bastar_vs_Other_Division_(2019).jpg)


.png/120px-Mestres_e_Doutores_cadastrados_na_Plataforma_Lattes_(2023).png)


.svg/120px-Odia_input_reader_survey_(Feb_16-Mar_16_2016).svg.png)


.png/120px-Radius_C_(PSF).png)


.png/120px-RfA_application_progression_(pie_chart).png)




_compared_to_the_rest_of_the_community%2C_8_January_2014.svg/120px-Top_editors_(including_bots)_compared_to_the_rest_of_the_community%2C_8_January_2014.svg.png)
